The international scientific and analytical, reviewed, printing and electronic journal of Paata Gugushvili Institute of Economics of Ivane Javakhishvili Tbilisi State University
Determination of optimal tax burden to achieve high rate economic growth (Case of Georgia)
Summary
This thesis analyzes the connection between the Gross Domestic Product (hereinafter the GDP) and tax revenues in 2011-2016. The tax burden to facilitate an optimal economic growth that is crucial for future development of the country was determined based on calculations. The so-called RA_GAP Methodology was considered for determining optimal tax burden.
Keywords: Gross Domestic Product (GDP); Tax burden; Economic Growth; Tax Gap; Potential tax revenues.
Introduction
The tax system should be such as not to suppress private entrepreneurial activity with the increase in budget revenues. The creation of an optimal tax system is one of the most difficult problems of economic theory and economic policy.
It is through the taxation that the state regulates the country’s economy, as it is the main instrument of formation of the revenue part of the country's budget.
It can be said that following to the post-communist period, the fiscal crisis in Georgia had a self-enhancing character. High taxation of economic agents and low levels of tax returns have further strengthened the inequality of tax burden.
Tax burden is calculated for both the country as well as by the institutional units (corporation, enterprise). “Tax Pressure” is considered as a synonym for “Tax burden”. Tax burden (pressure, taxation rate) – is the country's total tax revenue ratio in terms of Gross Domestic Product, expressed in percentage.
In the world of widely proven tax regulation, entrepreneurship development incentives have not been taken into account in Georgia's fiscal policy, which has adversely affected economic development, it can be said that it suppressed the production.
The actuality of the topic of study is due to the fact that, with the determination of potential tax burden, it is possible to achieve the optimal economic growth.
* * *
For clear representation of the macro level optimal tax burden on the example of the economy of Georgia it would be good to form the dynamic Laffer curve [Laffer, 2014] according to the period of 2011-2016 . It is known that the cost of the value added tax (hereinafter as ‘VAT’) on Tax Revenue in the Budget is best described by the Laffer curve.
As well as the results got by other researchers, Balatski comes to a conclusion that Laffer Curve is nothing but a beautiful hypothesis which, on the whole, has not been proved by anything. Despite this, many researchers presume the existence of the Laffer Curve as something given a priori. [Papava, 2008].
The Laffer curve was formed from the very beginning in the macroeconomic context, due to which it was intended not for individual taxes, but for an averaged joint tax. Instead of the latter, the so-called Tax Burden Index was used very often which is defined as the sum of tax revenues typically incorporated into the budget as a whole. In order to make this indicator reflect the current economic situation, instead of collected taxes, it should take the tax revenue into consideration.
Tax Gap Analysis ensures the tax authorities and tax policy defined entities with the lost, potential revenues, gap caused by unauthorized actions, not paying taxes, and existing tax policies (which were not declared, no payment has been paid, tax payment concession have been released).
Namely, there is a deliberate distortion of data in the declarations submitted by entrepreneurs to the respective bodies, more or less covering almost all spheres of public life in Georgia. Generally, corruption is one of the main reasons for mobilizing tax revenues in the budget [Shevardnadze ... 2000].
Considering that the share of VAT taxes in Georgia in 2005-2016 amounted to 44%[1] of the country's total tax revenues, thus determining the potential value of this tax shall be essential for our research.
According to the International Monetary Fund explanation [Eric Hutton, 2017], the tax gap is the difference between the potential tax revenue from current economy and the actual taxing.
According to the methods statement of the Monetary Fund, the potential VAT adaptation is carried out in the sphere in compliance with a predetermined model, based on the added value created in each sector. This method of determining potential VAT will pass the same path required for individual taxpayers to calculate VAT payable in the budget. The total tax liability of a particular taxpayer in respect to VAT is as follows: VAT accrued on import by it + VAT imposed on the country’s territory – and the VAT amount of goods and services acquired within the economic activity (exports in all countries shall be taxed at the VAT zero rate and when calculating Tax gap on it the VAT rate usually does not affect it). As for the general model, it works with national accounts, more specifically with the “resources and use” tables that systematically published by the country's statistical bodies. Depending on the spreadsheet, the potential VAT amount is determined by the sectors: VAT on imports and VAT accrued on the territory, with reduced VAT amount to be taken into consideration.
The above value model can be displayed as follows:
![]()
Here:
S – is a specific sector.
PVms - Potential VAT on the import of specific sector
PVos - Potential VAT on the output of a specific sector
PVis- Potential VAT on Consumer Sector Consumption (i.e. Resources / Expenditures)
The overall tax gap structure can be visually presented as follows:

Tax gap
Potential accrual
As it is known, the dynamic Laffer curve with Balatsky interpretation [E.V. Balatsky, N.A. Ekimova, 2011] will be recorded by the following formula:
X = a*q + b*q2 (1) Where a and b are assessable parameter options.
The model (1) simultaneously gives us three indicators. These are the dynamic Laffer point (q), the static Laffer point (q2) and the maximum growth rate of the economy (x).
The model (1) shows the dependence between the growth rate and the tax rate of the Gross Domestic Product.
X = Xt/Xt-1 - there is an increase in the Gross Domestic Product;
q = T/X - the tax burden that is calculated for the year by the correlation of tax returns sum with the same year Gross Domestic Product.
As it is known, one of the main demands of the National Accounts System (EAS) is that the tax reports reflect the use of the accrual method, which implies that the time of reflection in the tax report must coincide with the moment of origin of a tax liability. Another aspect of EAS is the following: fines, percentages for not paying taxes in due times or at all and other penalty sanctions must be accounted for separately from taxes. In practice, the sanctioning of fines shall be carried out separately from 2016 together with taxes, together with the activating a Single Treasury Account.
Calculation of tax burden carried out by us, instead of VAT payment indicator, is based on actual accruals and potential gap accruals.
Table №1 below shows the VAT accrual gap and its dynamics in 2011-2016.
Table №1: Dynamics of VAT gap in Georgia in 2011-2016
|
Year |
GDP in active values |
Accumulation gap (% GDP) |
Must be added to a real accrual |
Accrued VAT |
To calculate the total VAT burden* |
|
2011 |
24,343,986,583 |
0.4 |
97,375,946 |
2,250,992,327 |
2,348,368,273 |
|
2012 |
26,167,283,503 |
-0.2 |
-52,334,567 |
2,526,098,612 |
2,526,098,612 |
|
2013 |
26,847,354,249 |
-0.1 |
-26,847,354 |
2,733,684,495 |
2,733,684,495 |
|
2014 |
29,150,481,302 |
0.7 |
204,053,369 |
2,376,458,399 |
2,580,511,768 |
|
2015 |
31,755,555,634 |
0.7 |
222,288,889 |
3,095,126,694 |
3,317,415,583 |
|
2016 |
34,028,452,192 |
0.9 |
306,256,069 |
3,413,264,850 |
3,719,520,920 |
Source: www.mof.ge; www.geostat.ge.
- The negative value of the 2012-2013 gap is not taken into consideration due to content inconsistencies; Calculation of 2016 with its own interpretation.
It would be reasonable to determine the tax burden in constant prices, as calculation in current prices has only a fiscal effect [Kbiladze, 2014]. Consequently, the growth of Georgia's GDP realized in constant prices (as compared to the previous year) and potential VAT burden in 2012-2016 are presented in Table №2.
Table №2.
|
Year |
Real growth of the economy |
Tax burden q |
|
2012 |
1.0635 |
0.0993 |
|
2013 |
1.0339 |
0.1045 |
|
2014 |
1.0462 |
0.0915 |
|
2015 |
1.0288 |
0.1099 |
|
2016 |
1.0285 |
0.1173 |
Source: www.geostat.ge, www.mof.ge
With the results of the regressive analysis conducted, the Laffer curve for Georgia's economy can be summarized as follows: X = 21,0929q - 105,8423q2.
With the parabola effect we get the optimal tax burden, i.e. the dynamic lapse point q = 9,96%, and the optimum growth of the economy is 105.3 (5,3%). The value of static lacquer curve is equal to 7.77% and 12,16%.
Dynamic and static Laffer curves
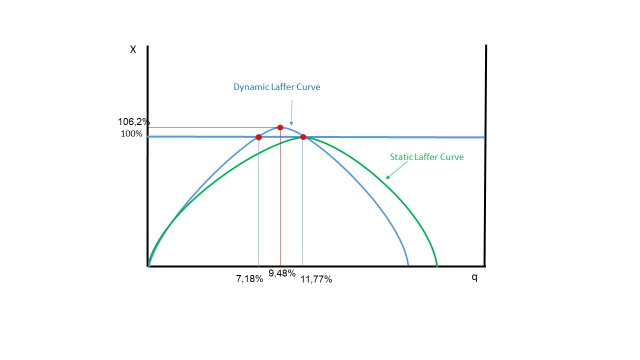
Static Laffer curve points denote such state of the economy when the GDP maintains a steady pace of growth that equals to one. Among these points falls the fiscal policy action range. Estimated values of static Laffer points for the Georgian economy are 7,77% and 12,16%. This means that lowering the tax burden below 7.77% will cause the country's economic downturn, as well as increase of VAT tax cargo over 12,16%, means bringing the country's economy into recession.
In terms of optimization, it is deemed to be rational if the value of VAT potential tax burden will be closer to 9,96% from the left. At this point, the Georgian economy had the potential to achieve a maximum 105.3% growth rate, i.e. increase by 5.3%. However, for reimbursement of necessary budgetary expenditures the executive and legislative bodies engaged in drawing up fiscal policies will select for the VAT tax consignments parameters falling within the range of 9,96% - 12,16%. In such conditions, except to that the budget revenues are high, the economy is growing consequently. Thus, 9,96% of VAT tax cargo - 12,16% interval is a control, forecasting and orientation parameter.
Table №3.
|
Year |
Nominal GDP, at constant prices (in mln. GEL) |
VAT payments, at constant prices (fact) (in mln. GEL) |
Paid VAT Burden compared with GDP % |
Potential / accrued VAT, at constant prices (in mln. GEL) |
Potential / accrued VAT Burden compared with GDP % |
|
2011 |
22,241 |
2,565.2 |
11.5 |
2,163.5 |
9.7 |
|
2012 |
23,653 |
2,827.7 |
12.0 |
2,349.5 |
9.9 |
|
2013 |
24,454 |
2,662.4 |
10.9 |
2,555.6 |
10.5 |
|
2014 |
25,585 |
2,991.8 |
11.7 |
2,340.6 |
9.1 |
|
2015 |
26,322 |
3,057.1 |
11.6 |
2,893.1 |
11.0 |
|
2016 |
27,072 |
2,806.3 |
10.4 |
3,176.1 |
11.7 |
Source: www.mof.ge www.rs.ge
It is generally recognized that the reduction of taxes (tax burden) in market economies results in stimulating investments. Here it is meant to reduce the tax rate on entrepreneurship, salaries and dividends. If we take into account the results of our survey and calculation, we conclude that the VAT tax burden should be approaching 9,96% to achieve a maximum growth rate of 105.3%. For the growth of economy in Georgia, it is necessary to stimulate the investment process that will result into creation of additional jobs and additional output.
Conclusion
It is easy to conclude that without VAT Tax Gap calculation, it would be wrong to define the optimal tax burden and thus determine the optimal economic growth rate.
Calculation of optimal tax cargo, instead of VAT payment index, is based on real accruals and the gap of potential accruals, according to RA_GAP methodology.
The cost of the thesis, its theoretical and practical application derives from the fact that the determination of optimal tax burden determines the need for fiscal policy change, suggesting whether the tax burden has to be increased or reduced. The survey provides the information as to what type of tax burden can make the country achieve a higher rate of economic growth (maximum GDP).
Literature:
- Ananiashvili ‘Ideal Tax Burden for the Development of Economy’ the Magazine TSU Science, N1, Tbilisi, 2011
- T. Kbiladze, Problems of determining the optimal level of tax burden in Georgia, 2014
- I. Ananiashvili, V.Papava, Equilibrium and Optimal Tax Rates in the Models of Aggregate Demand and Aggregate Supply (Laffer-Keynesian Synthesis), Bulletin of the Georgian National Academy of Sciences, 2013
- I. Ananiashvili, V. Papava ‘Macroeconomic Equilibrium Under the Laffer-Keynesian Synthesis Conditions’, the Magazine Economist, N5, Tbilisi, 2010
- V.Papava, Alternatives of the Laffer Curve with “Hysteresis”, Bulletin of the Georgian National Academy of Sciences, 2009
- V. Papava, Theoretical Foundations of the Laffer Curve, 2008.
- K.Shevardnadze, R.Chechelashvili, V.Chocheli, N.Khaduri, “Papava Indexes of Tax Corruption”, Tbilisi, 2000
- Laffer A.B. The Laffer Curve: Past, Present and Future// Heritage Foundation Backgrounder, №1765, 2004, June 1
- The Revenue Administration—Gap Analysis Program: Model and Methodology for Value-Added Tax Gap Estimation Eric Hutton Fiscal Affairs Department INTERNATIONAL MONETARY FUND, 2017
- Center for Social and Economic Research (“CASE”), CPB Netherlands Bureau for Economic Policy Analysis, in consortium with CAPP, CEPII, ETLA, IFO, IFS and HIS (‘CASE’), 2013, “Study to Quantify and Analyze the VAT Gap in the EU-27 Member States Final Report” (Warsaw, Poland). http://ec.europa.eu/taxation_customs/common/publications/studies/index_en.htm.
- European Commission Directorate General Taxation and Customs Union, 2016, “The Concept of Tax Gaps, Report on VAT Gap Estimations”, Brussels https://ec.europa.eu/taxation_customs/sites/ taxation/files/docs/body/tgpg_report_en.pdf.
- Е. В. Балацкий, Н. А. Екимова, Налогово-бюджетная политика и Економический рост, «Обшество и економика» №4-5, 2011
- Гусев А.Г. Влияние фискальных инструментов на экономический рост: методы макроанализа. Диссертация на соискание ученой степени кандидата экономических наук. М.: ИМЭИ. 2003.
[1] Source: www.mof.ge; www.geostat.ge